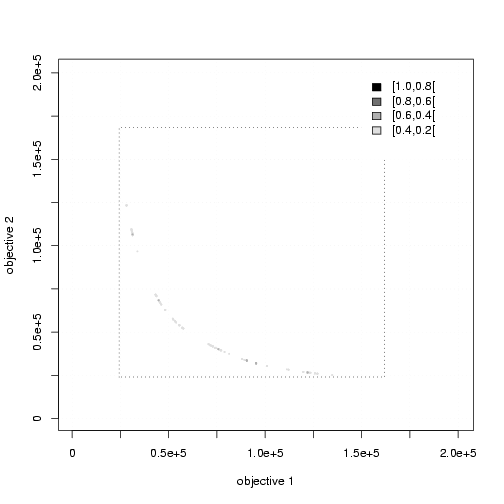
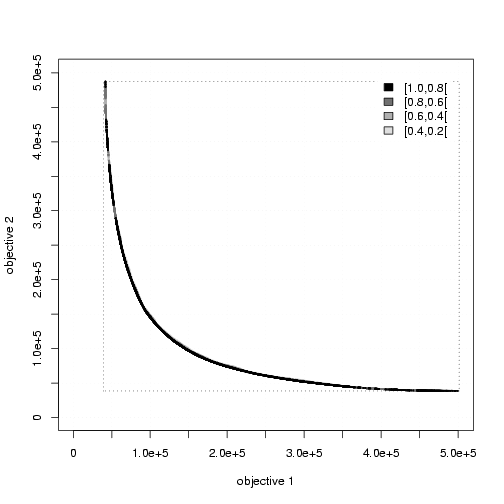
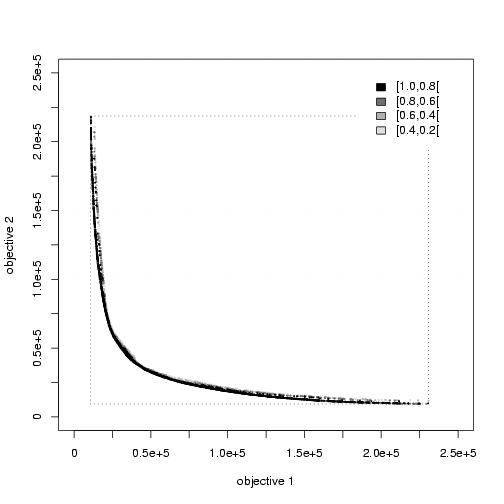
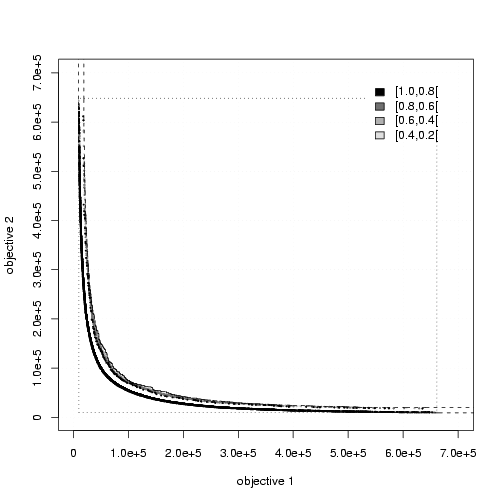
Benchmark
results for the Biobjective Traveling Salesman Problem
This webpage supports the article "Design and analysis of
stochastic local search for the multiobjective traveling salesman problem"
by L. Paquete and T. Stützle.
Short-cut:
Three types of biobjective TSP instances were considered:
The instances are available here
Five types of SLS components were tested:
The experimental methodology followed three steps:
Notes (see publication for more details):
|
|
Size (n) |
||||||||||||||||||||||||||||||||||||||||||||||||||
|
100 |
300 |
500 |
|||||||||||||||||||||||||||||||||||||||||||||||||
|
Search
Strategy: |
Better Relations:
|
Better Relations:
EAF plots:
Restart vs. 2phase |
Better Relations:
EAF plots:
Restart vs. 2phase |
||||||||||||||||||||||||||||||||||||||||||||||||
|
Neighborhood
Structure |
Better Relations:
EAF plots:
2-opt vs. 3-opt |
Better Relations:
EAF plots:
2-opt vs. 3-opt |
Better Relations:
EAF plots:
2-opt vs. 3-opt |
||||||||||||||||||||||||||||||||||||||||||||||||
|
Component-wise
Step |
Better Relations:
EAF plots:
False vs. True |
Not tested; always shown to have a
positive effect in preliminary experiments. |
Not tested; always shown to have a positive effect in preliminary experiments. |
||||||||||||||||||||||||||||||||||||||||||||||||
|
|
Better Relations:
EAF plots:
0 vs. 50, 50 vs. 100 |
Better Relations:
EAF plots:
0 vs. 50, 50 vs. 100 |
Better Relations:
EAF plots:
0 vs. 50, 50 vs. 100 |
||||||||||||||||||||||||||||||||||||||||||||||||
|
Number of Scalarizations |
Better Relations:
EAF plots:
n vs. 5n, 5n vs. 10n |
Better Relations:
EAF plots:
n vs. 5n, 5n vs. 10n |
Better Relations:
EAF plots:
n vs. 5n, 5n vs. 10n |
||||||||||||||||||||||||||||||||||||||||||||||||
Random Instances
|
|
Size (n) |
||||||||||||||||||||||||||||||||||||||||||||||||||
|
100 |
300 |
500 |
|||||||||||||||||||||||||||||||||||||||||||||||||
|
Search
Strategy: |
Better Relations:
EAF plots:
Restart vs. 2phase |
Better Relations:
EAF plots:
Restart vs. 2phase |
Better Relations:
EAF plots:
Restart vs. 2phase |
||||||||||||||||||||||||||||||||||||||||||||||||
|
Neighborhood
Structure |
Better Relations:
EAF plots:
2-opt vs. 3-opt |
Better Relations:
EAF plots:
2-opt vs. 3-opt |
Better Relations:
EAF plots:
2-opt vs. 3-opt |
||||||||||||||||||||||||||||||||||||||||||||||||
|
Component-wise
Step |
Better Relations:
EAF plots:
False vs. True |
Not tested; always shown to have a positive effect in preliminary experiments. |
Not tested; always shown to have a positive effect in preliminary experiments. |
||||||||||||||||||||||||||||||||||||||||||||||||
|
|
Better Relations:
EAF plots:
0 vs. 50, 50 vs. 100 |
Better Relations:
EAF plots:
0 vs. 50, 50 vs. 100 |
Better Relations:
EAF plots:
0 vs.
50, 50 vs. 100 |
||||||||||||||||||||||||||||||||||||||||||||||||
|
Number of Scalarizations |
Better Relations:
EAF plots:
n vs. 5n, 5n vs. 10n |
Better Relations:
EAF plots:
n vs. 5n, 5n vs. 10n |
Better Relations:
EAF plots:
n vs. 5n, 5n vs. 10n |
||||||||||||||||||||||||||||||||||||||||||||||||
Mixed Instances
|
|
Size (n) |
||||||||||||||||||||||||||||||||||||||||||||||||||
|
100 |
300 |
500 |
|||||||||||||||||||||||||||||||||||||||||||||||||
|
Search
Strategy: |
Better Relations:
EAF plots:
Restart vs. 2phaseE, Restart vs. 2phaseR |
Better Relations:
EAF plots:
Restart vs. 2phaseE, Restart vs. 2phaseR |
Better Relations:
EAF plots:
Restart vs. 2phaseE, Restart vs. 2phaseR |
||||||||||||||||||||||||||||||||||||||||||||||||
|
Neighborhood
Structure |
Better Relations:
EAF plots:
2-opt vs. 3-opt |
Better Relations:
EAF plots:
2-opt vs. 3-opt |
Better Relations:
EAF plots:
2-opt vs. 3-opt |
||||||||||||||||||||||||||||||||||||||||||||||||
|
Component-wise
Step |
Better Relations:
EAF plots: False
vs. True |
Not tested; always shown to have a positive effect in preliminary experiments. |
Not tested; always shown to have a positive effect in preliminary experiments. |
||||||||||||||||||||||||||||||||||||||||||||||||
|
|
Better Relations:
EAF plots:
0 vs. 50, 50 vs. 100 |
Better Relations:
EAF plots:
0 vs. 50, 50 vs. 100 |
Better Relations:
EAF plots:
0 vs. 50, 50 vs. 100 |
||||||||||||||||||||||||||||||||||||||||||||||||
|
Number of Scalarizations |
Better Relations:
EAF plots:
n vs. 5n, 5n vs. 10n |
Better Relations:
EAF plots:
n vs. 5n, 5n vs. 10n |
Better Relations:
EAF plots:
n vs. 5n, 5n vs. 10n |
||||||||||||||||||||||||||||||||||||||||||||||||
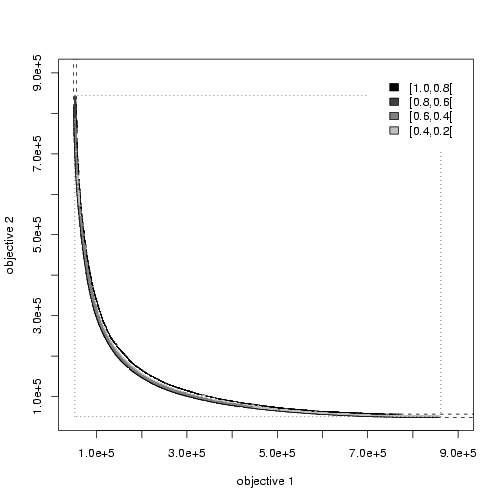
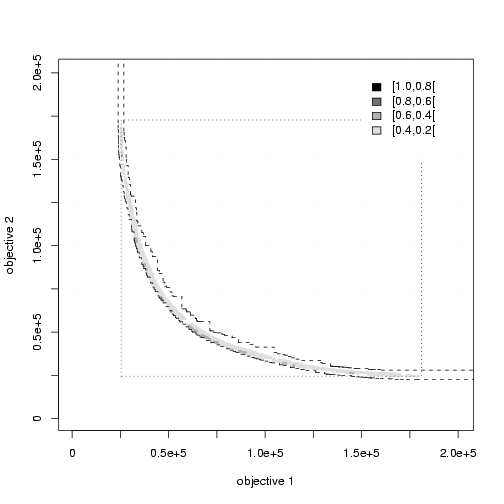
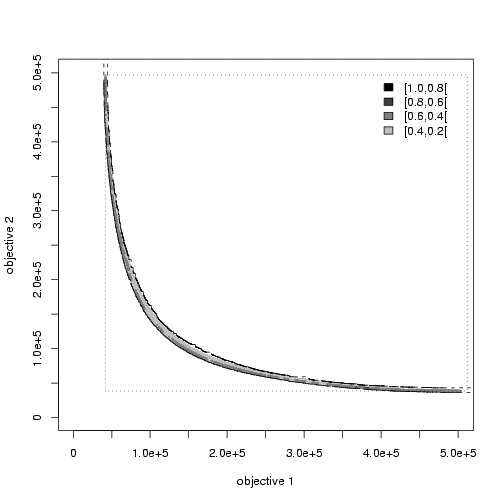
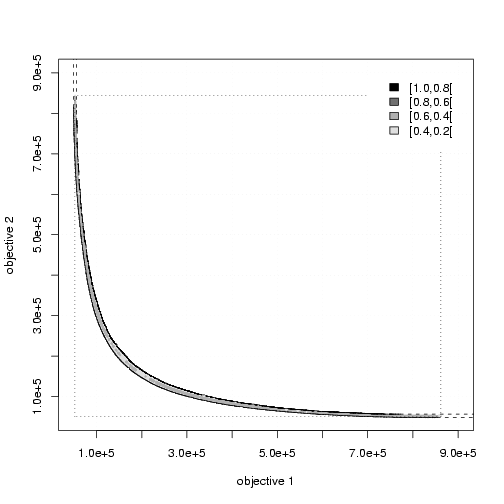
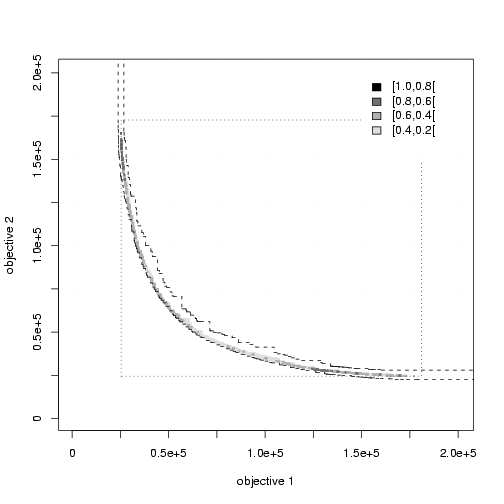
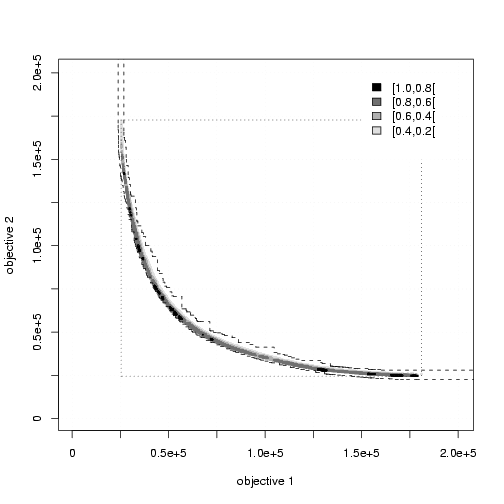
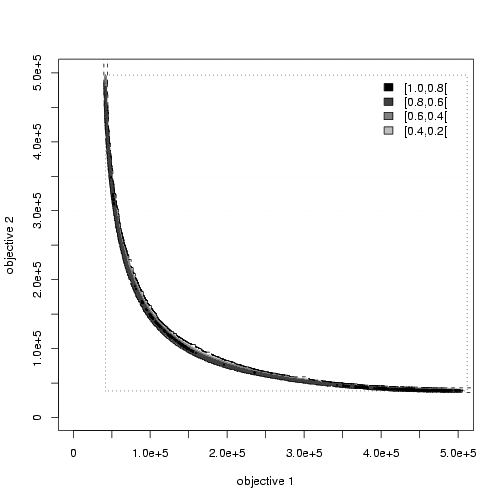
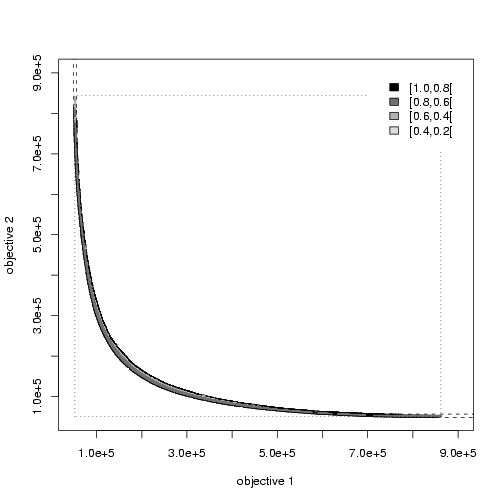
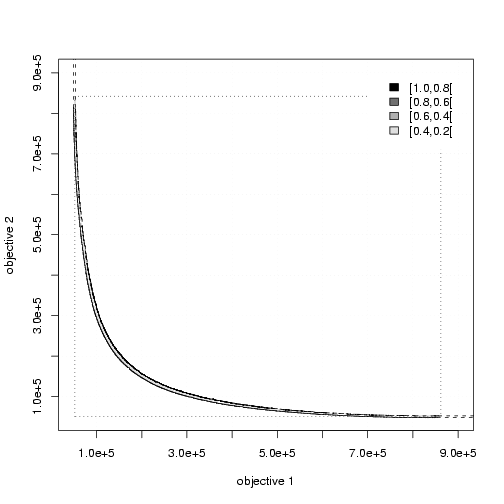
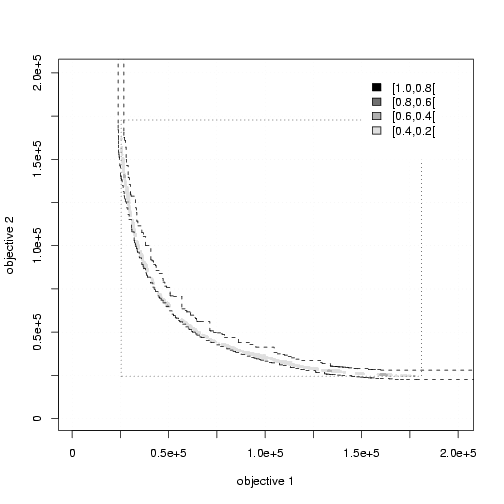
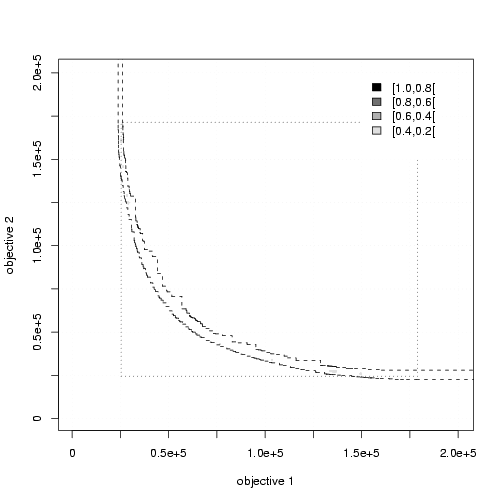
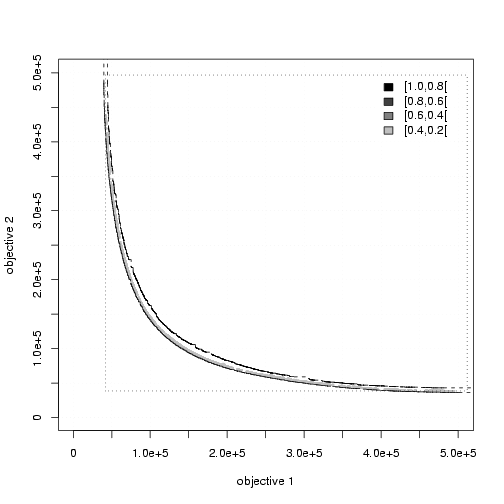
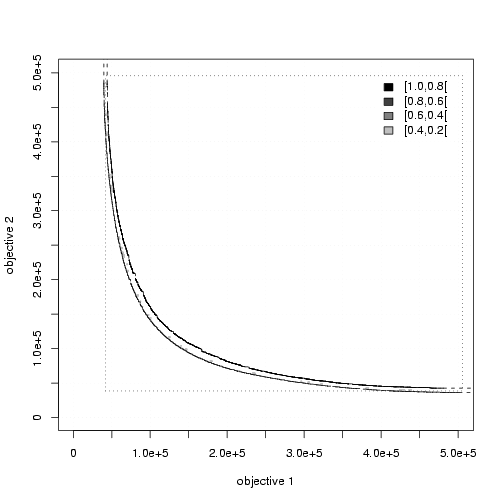
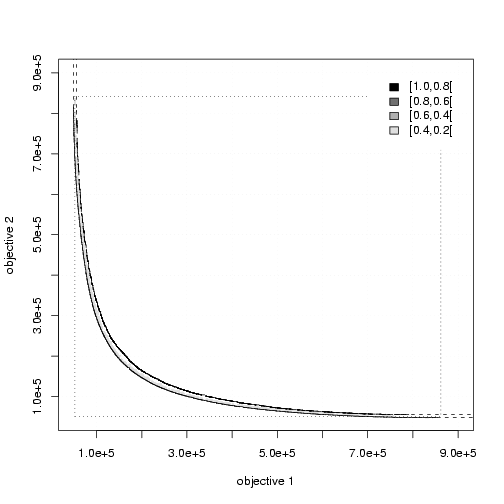
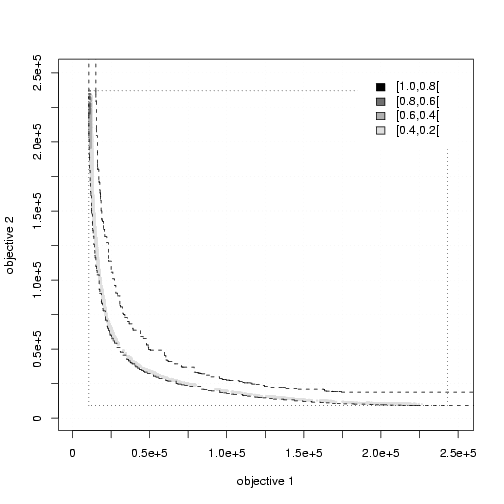
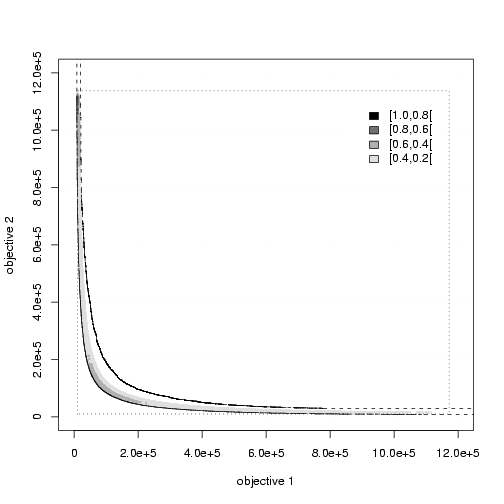
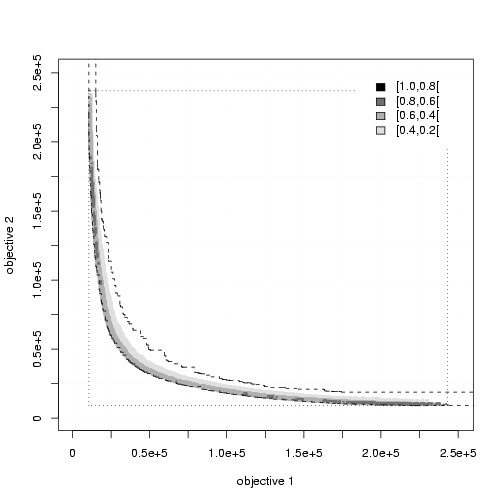
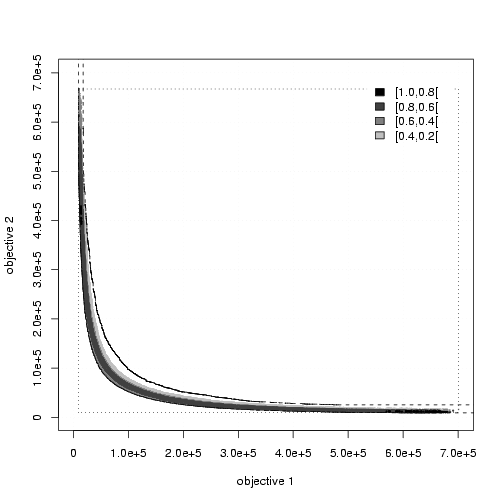
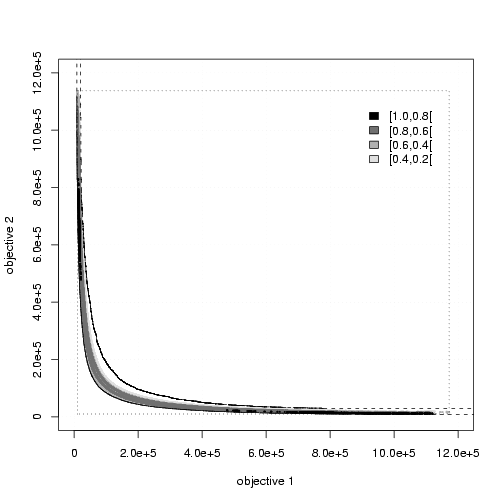
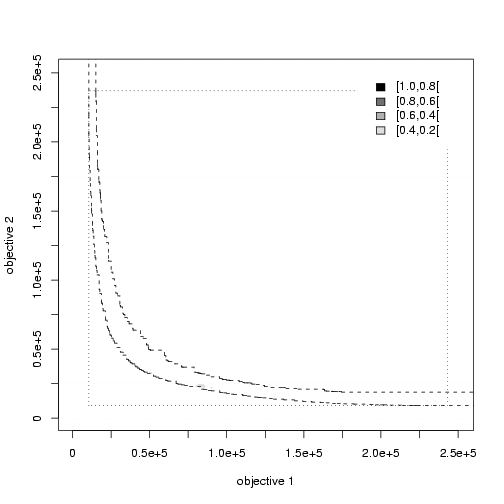
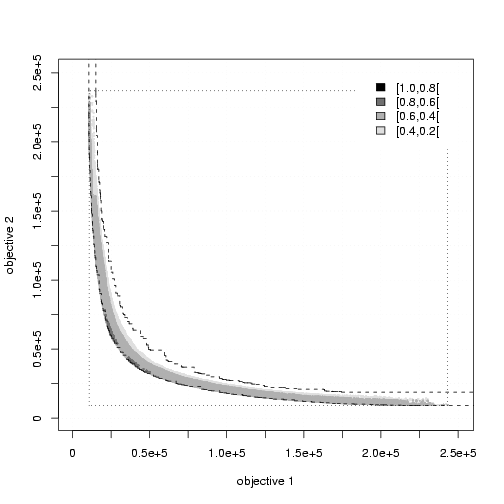
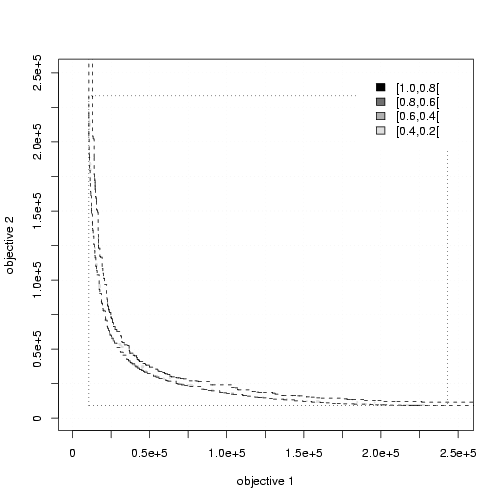
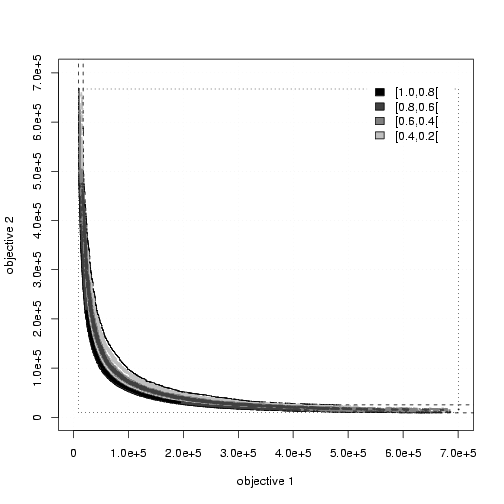
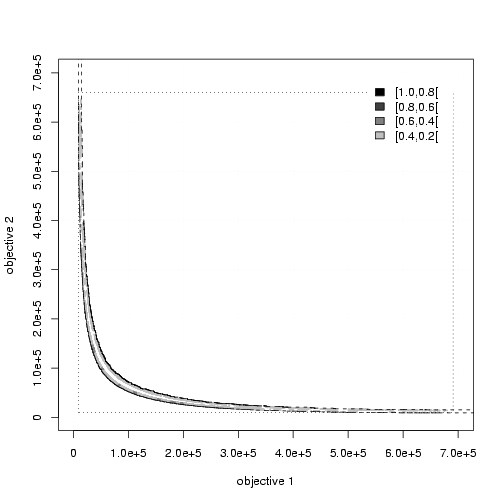
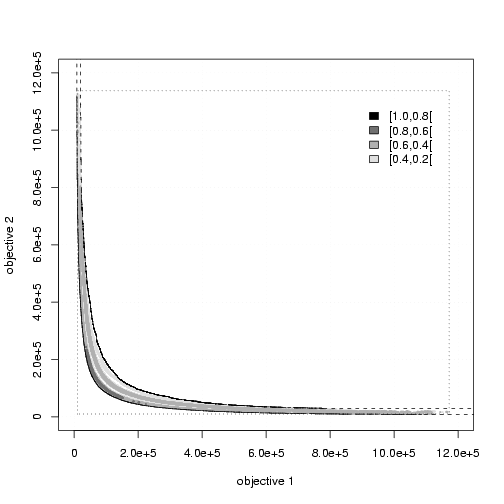
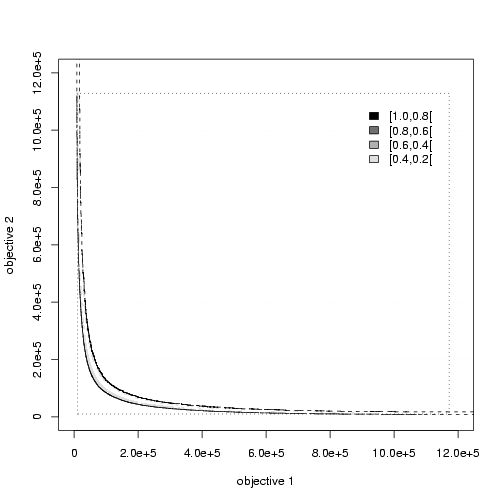
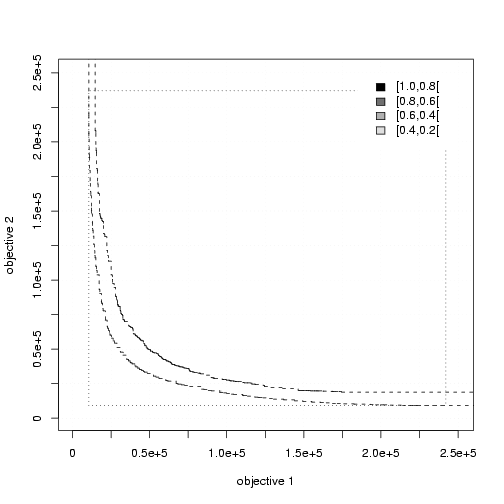
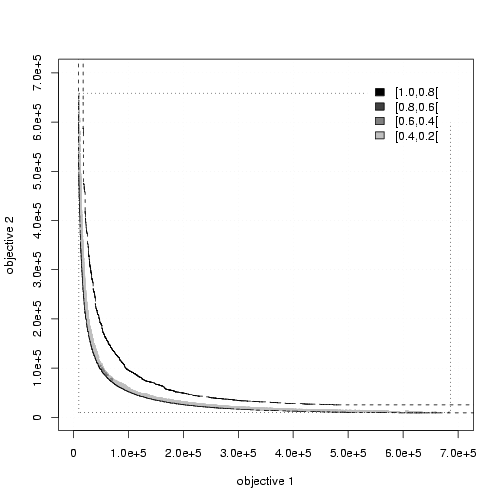
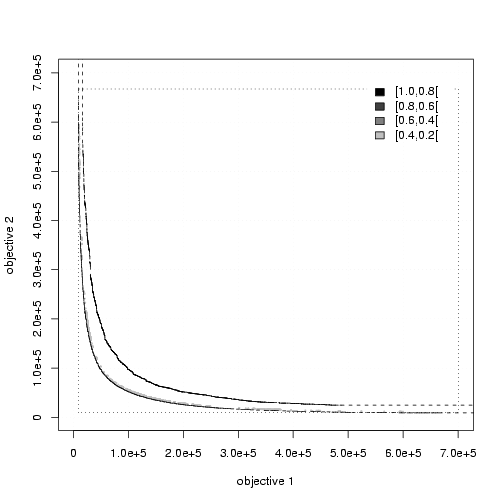
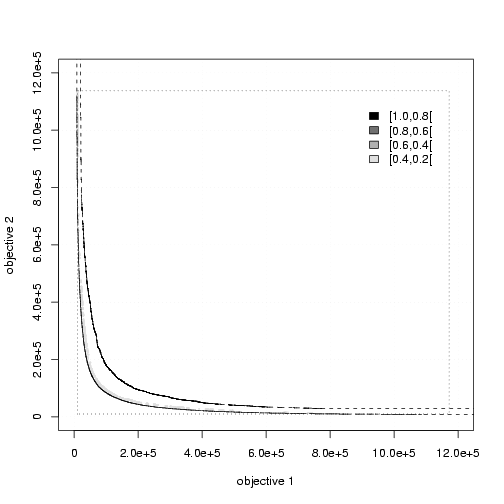
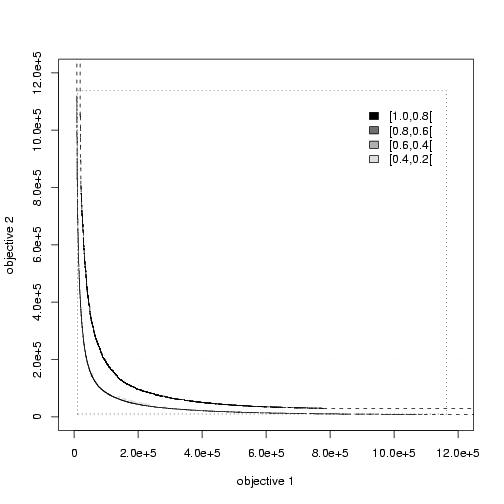
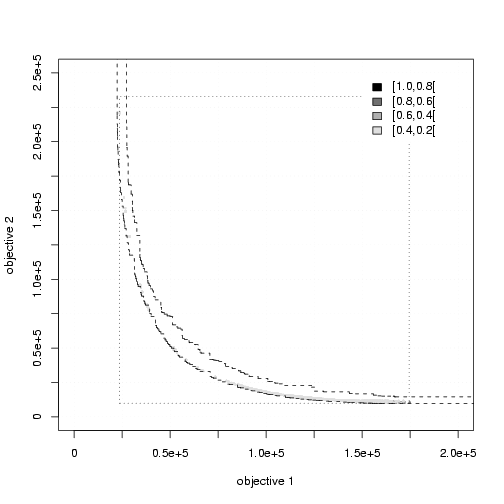
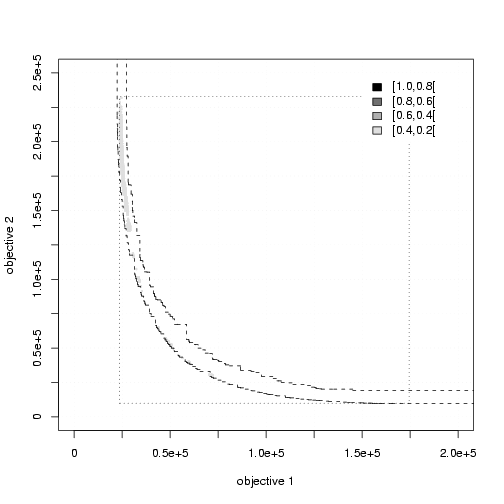
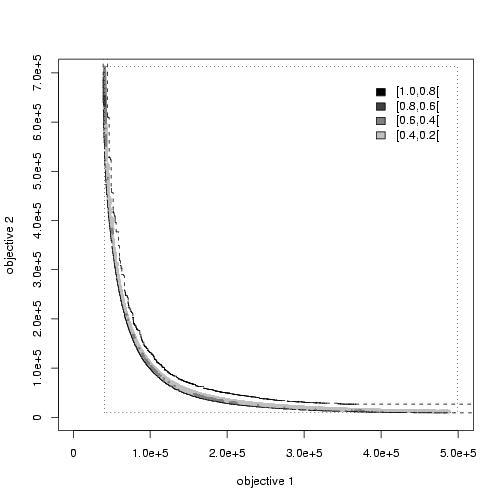
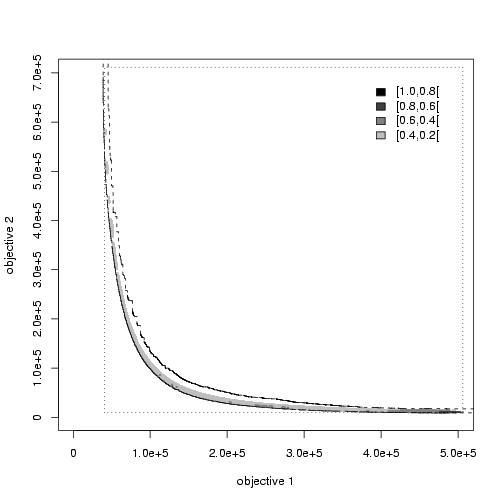
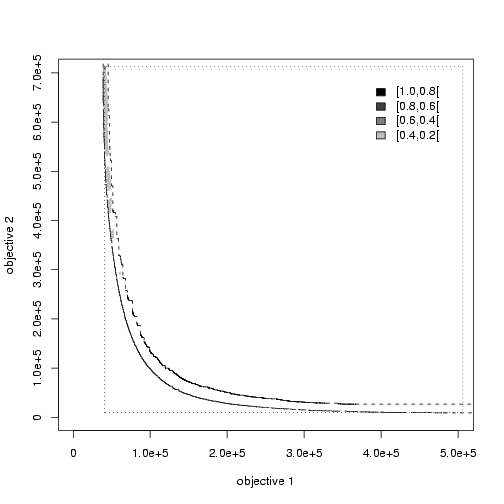
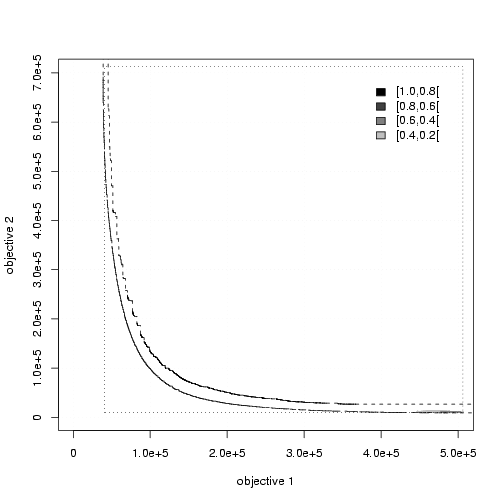
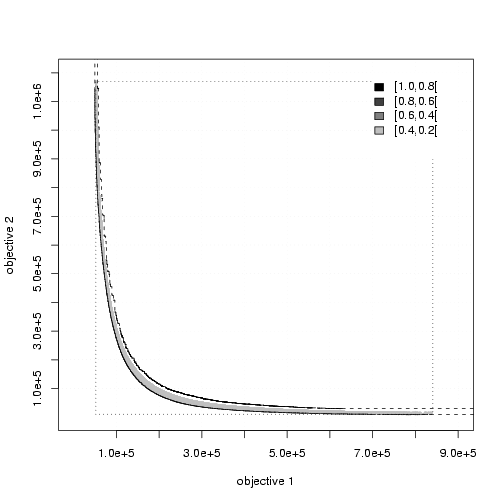
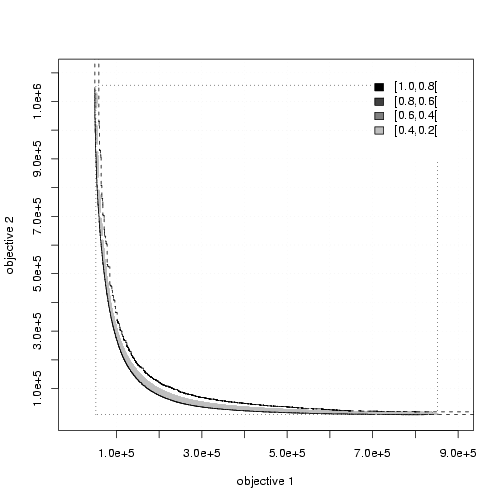
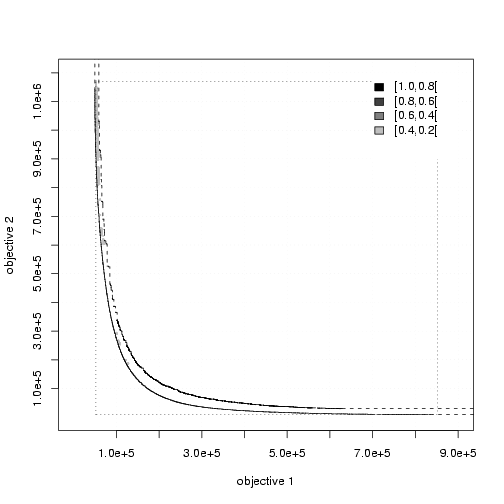
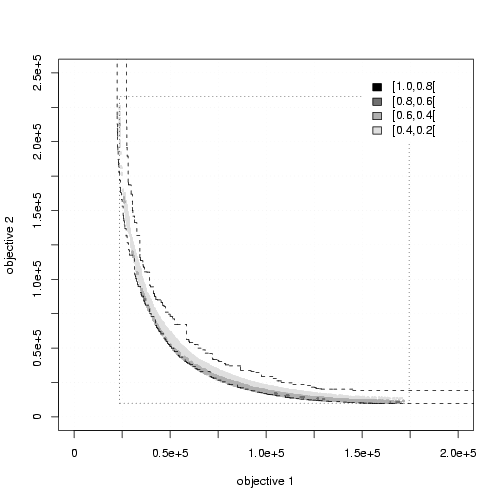
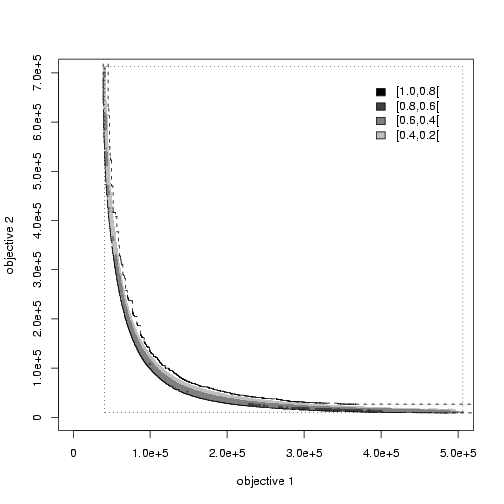
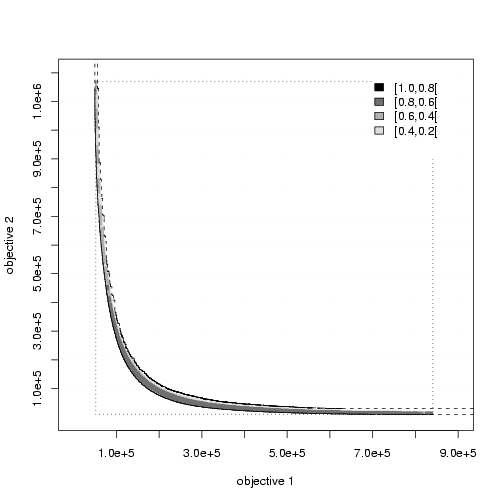
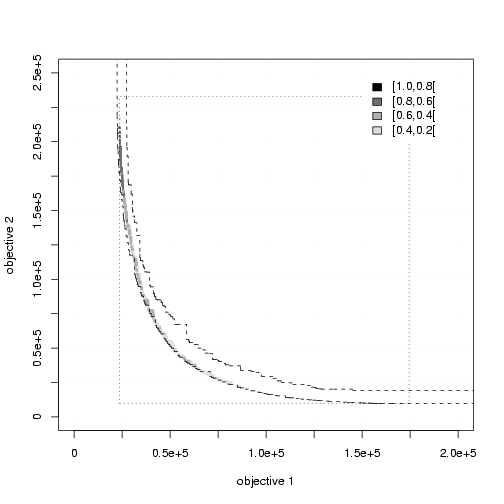
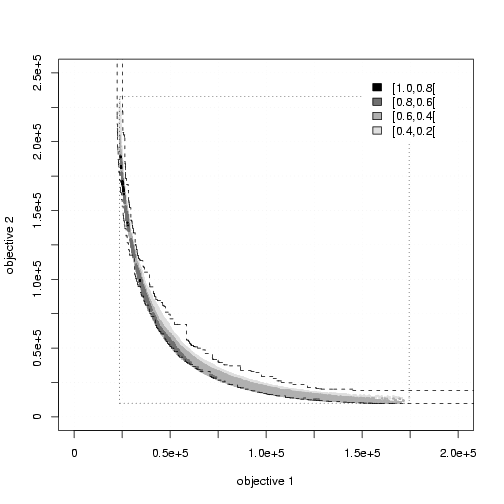
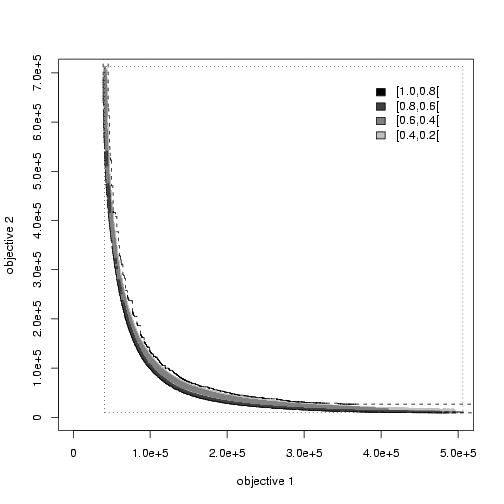
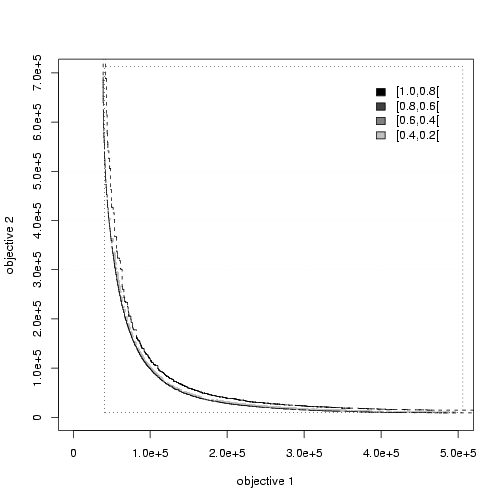
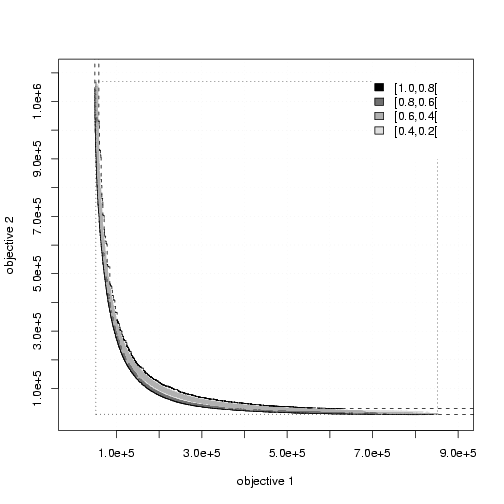
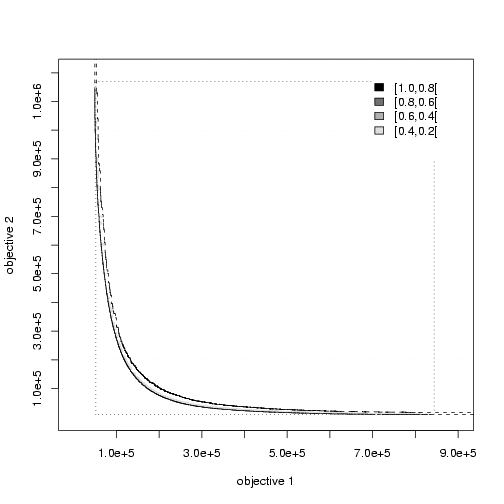
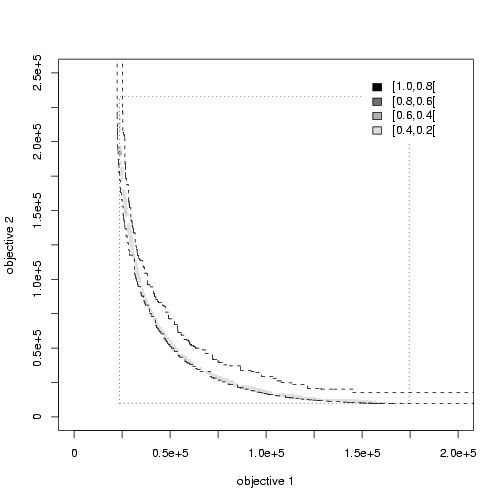
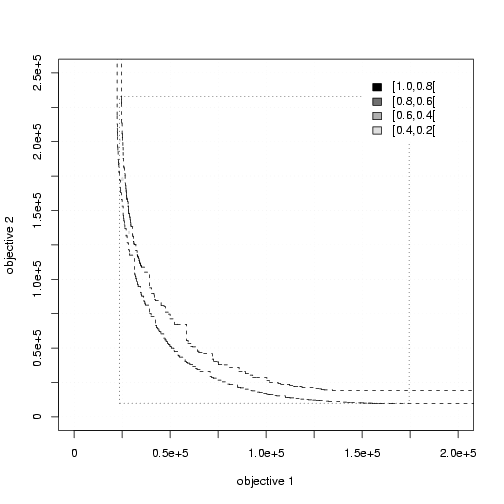
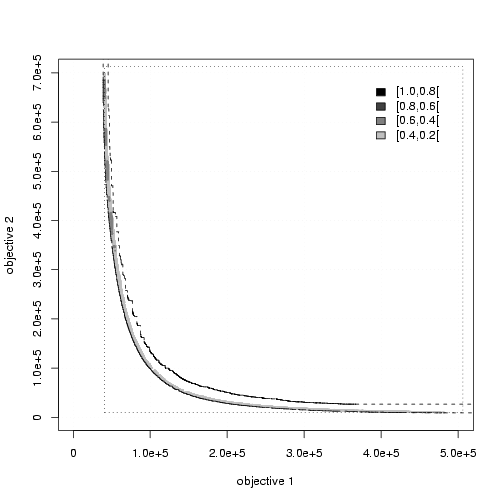
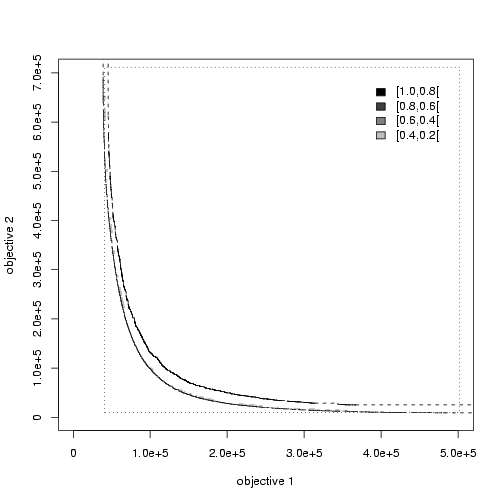
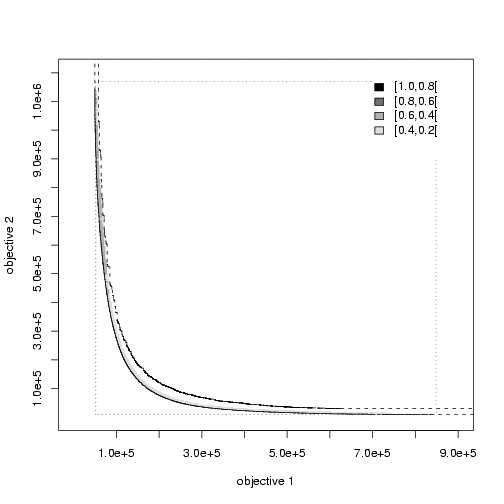
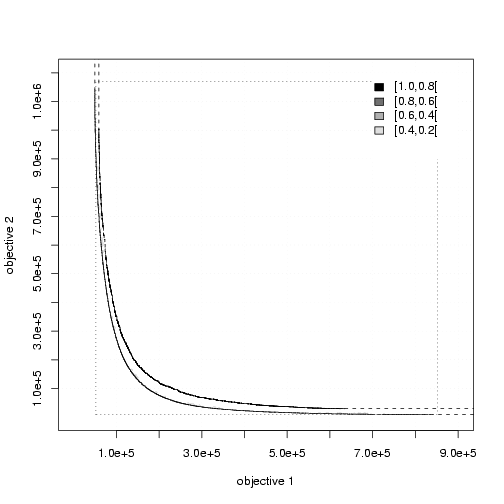
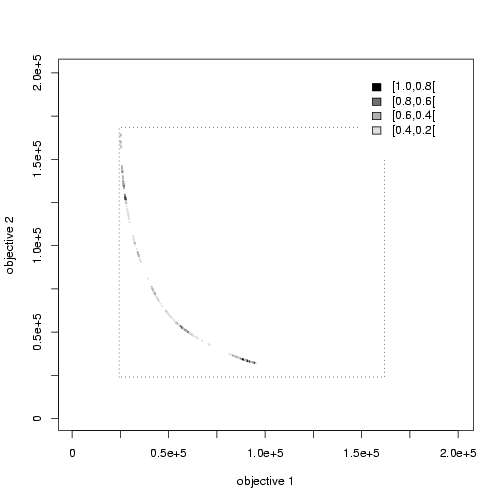
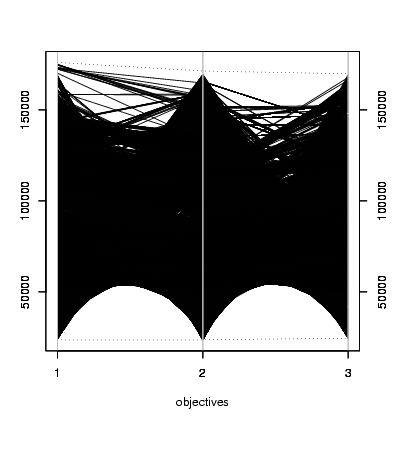
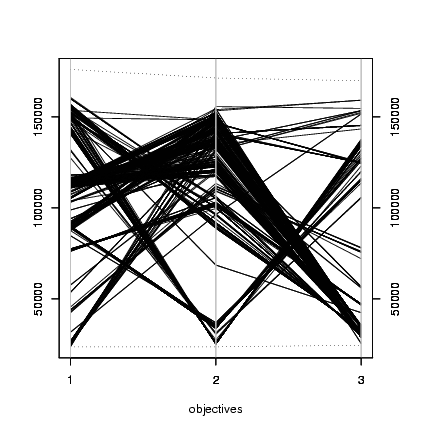
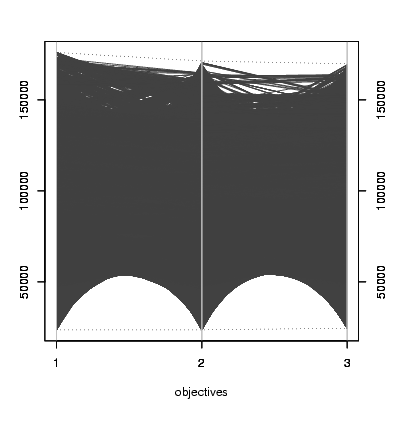
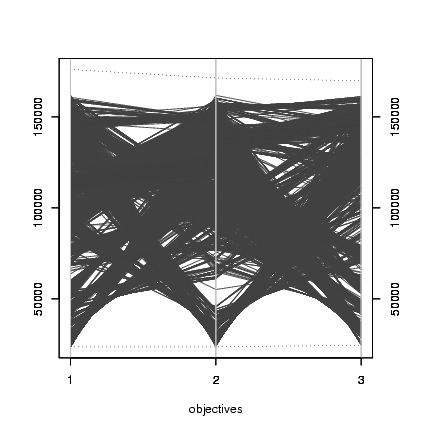
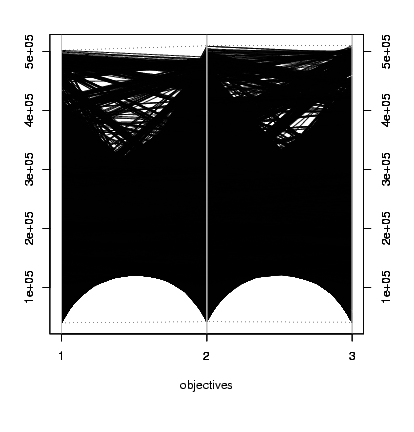
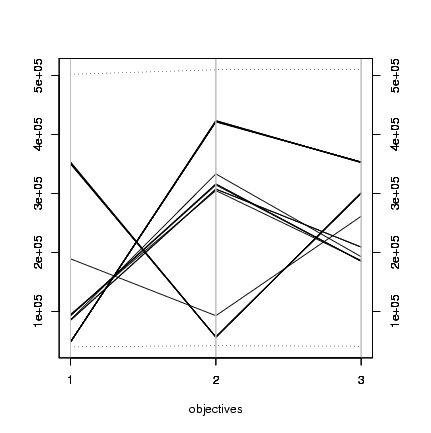
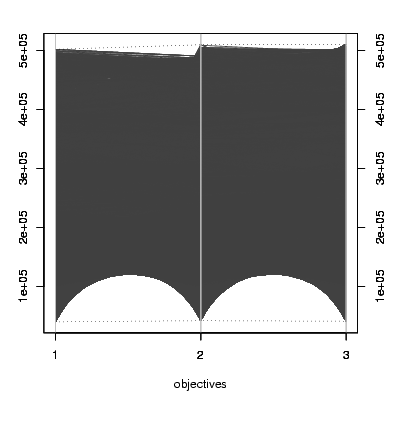
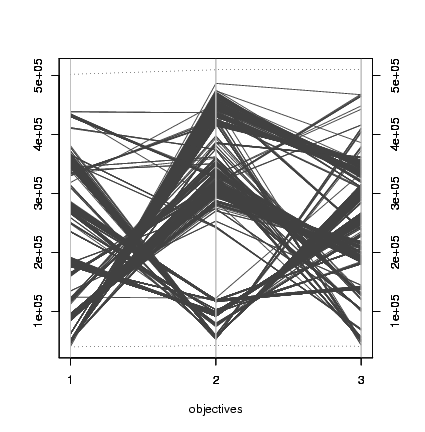
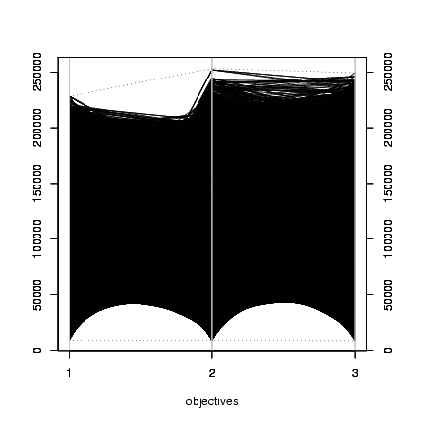
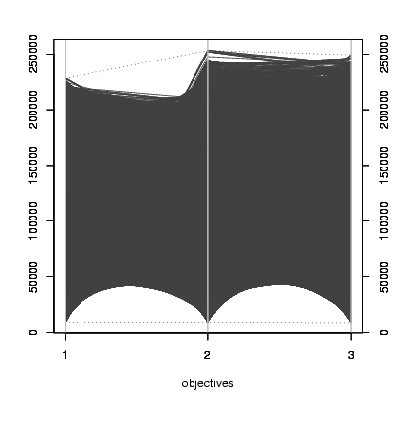
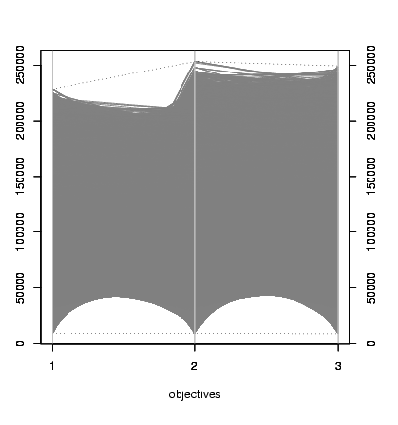
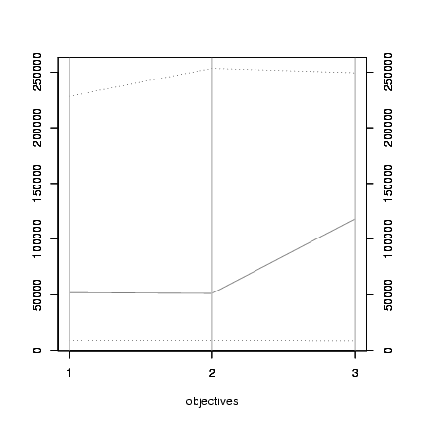
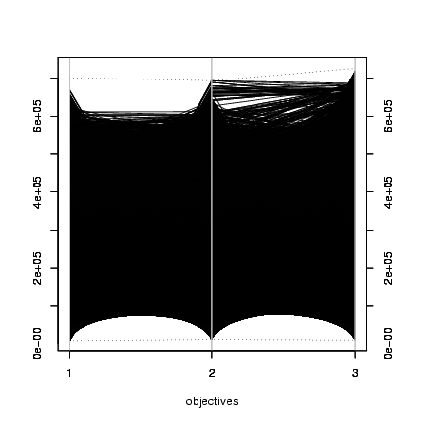
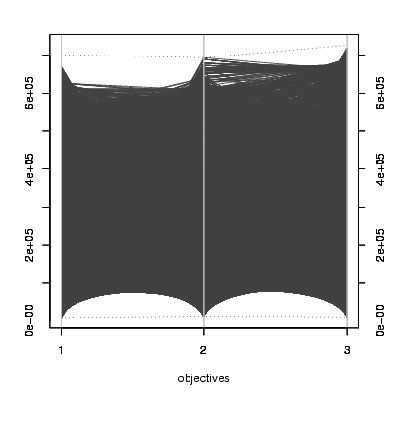
Only the EAF plots are shown.
For the 3 objective instances, we show the EAF plots with parallel coordinates
for a given range of differences.
|
|
|
Size
|
|
|
|
|
100
|
300
|
2 Objectives
|
Euclidean
|
Ours vs. MOGLS
|
Ours vs. MOGLS
|
|
|
RDM
|
Ours vs. MOGLS
|
Ours vs. MOGLS
|
3 Objectives
|
Euclidean
|
(80%,100%]: Ours vs. MOGLS
(60%,80%]: Ours vs. MOGLS
|
(80%, 100%]: Ours vs. MOGLS
(60%,80%]: Ours vs. MOGLS
|
|
|
RDM
|
(80%, 100%]: Ours vs. MOGLS
(60%,80%]: Ours vs. MOGLS
(40%,60%]: Ours vs. MOGLS
|
(80%, 100%]: Ours vs. MOGLS
(60%, 80%]: Ours vs. MOGLS
|